Climate Technology Map, an Optimistic Future Expressed via a Color Wheel
Climate Tech Map is a digital platform for students, researchers, entrepreneurs, and investors seeking to participate in climate technology innovation. It is a website structured to make the rapidly growing climate technology ecosystem easy to understand, covering a wide range of technologies from current ones to those with the potential to emerge in the future. Beyond being a simple information site, it also serves as a guide offering direction toward a better climate future.
The project was led by Speed & Scale, which compiled a list of over 2,000 technologies through workshops with various climate-related organizations. Subsequently, Pentagram, specifically the Giorgia Lupi team, participated in research, information structure design, and content strategy to create a structure capable of transforming complex data into real-world experiences.
The design is inspired by the era of the space race, celestial maps, and uncharted frontiers. As a result, the entire site conveys an exploratory and optimistic atmosphere while maintaining a systematic and organized impression. By combining a colorful graphic system, sophisticated typography, and unique interactions, the design ensures that the search for information itself becomes an engaging experience. Elements such as cows, solar panels, electric vehicles, flames, and chimneys are also depicted through geometric illustrations to convey technological themes in a friendly manner.
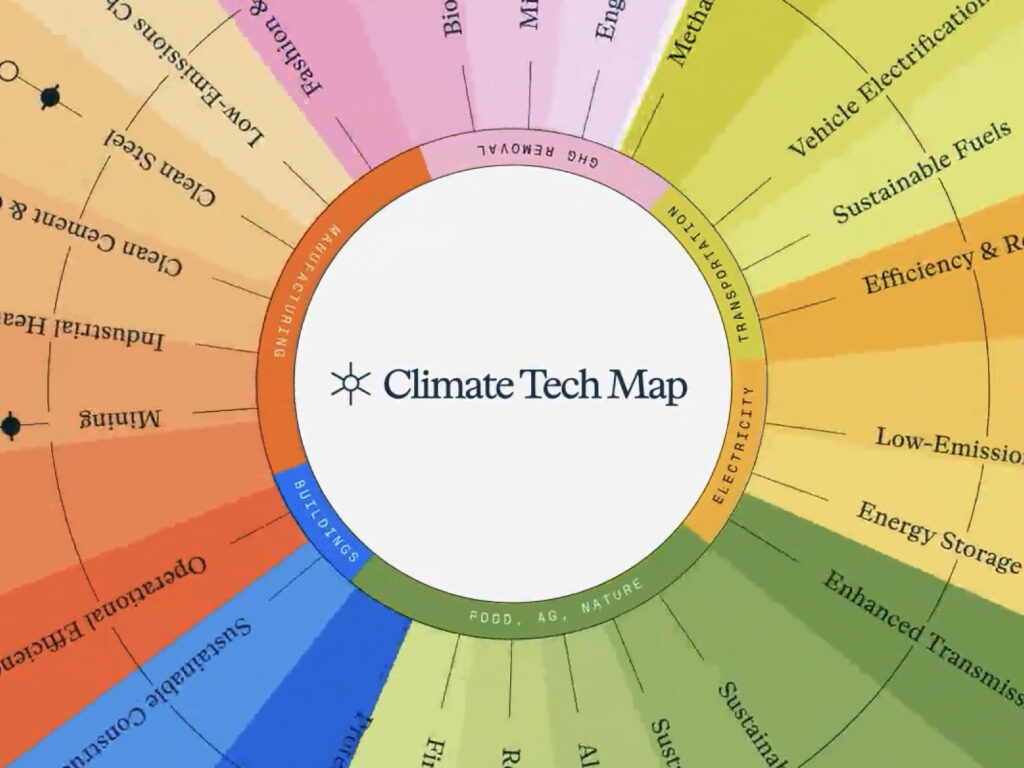
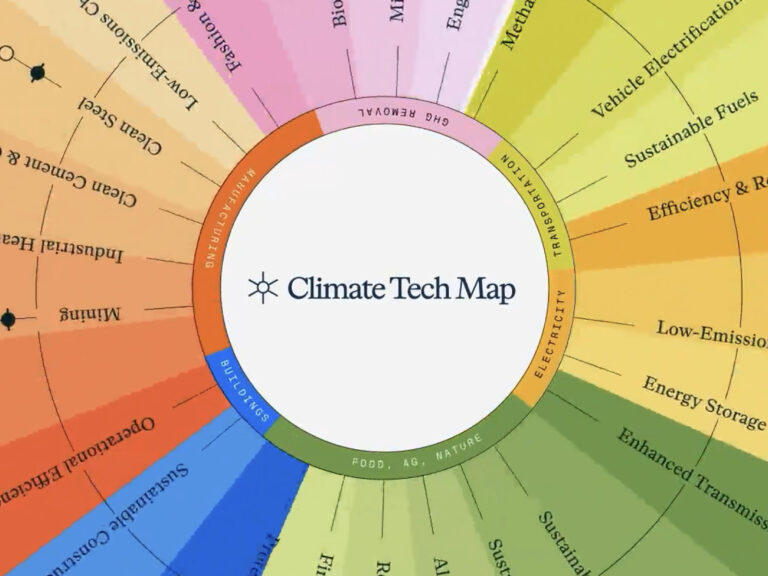
The core interface is the 'Wheel' structure of the main screen. Divided into six major sectors and 24 Opportunity Areas, its form, reminiscent of constellation maps, sunbeams, and spotlights, helps users easily find their areas of interest. Each section includes infographics, background explanations, videos, and related technology strategies, and users can also separately explore 100 technology categories connected to energy transition.